Technological change is an area in which individuals have consistently underappreciated pace. Through the decades our ability to adopt/consume technology has increased significantly (Figure 1). However, as humans, we regularly fail to appreciate this fact and as such disruptive technologies are often initially overlooked.
Figure 1: Waves of technological change
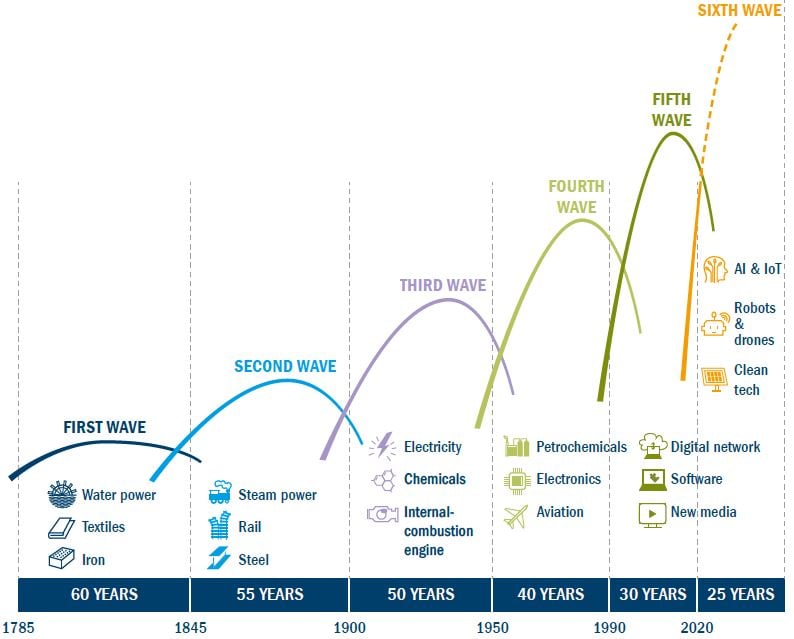
Source: Visual catalyst and Edison Institute, 2021
Figure 2: How New York became a one-horse town
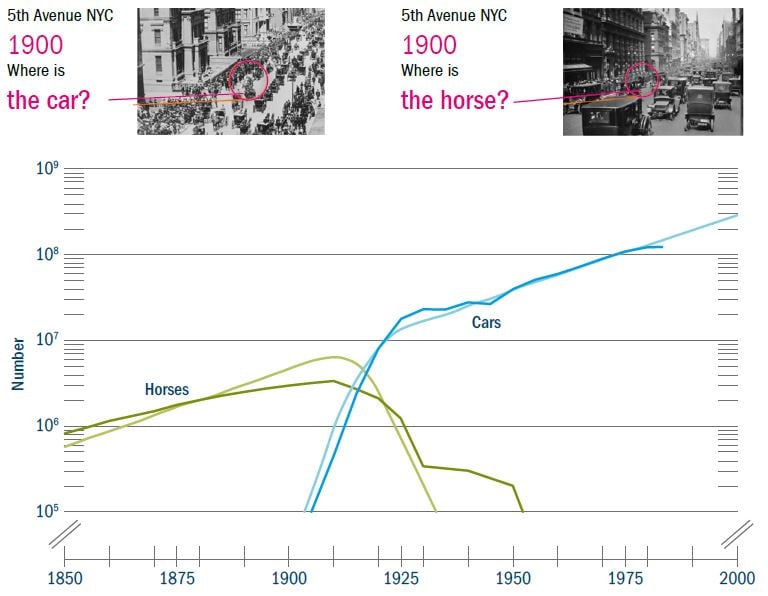
Source: Visual catalyst and Edison Institute, 2021
The next rapid transition?
Figure 3: Share of low-carbon sources and coal in world electricity generation
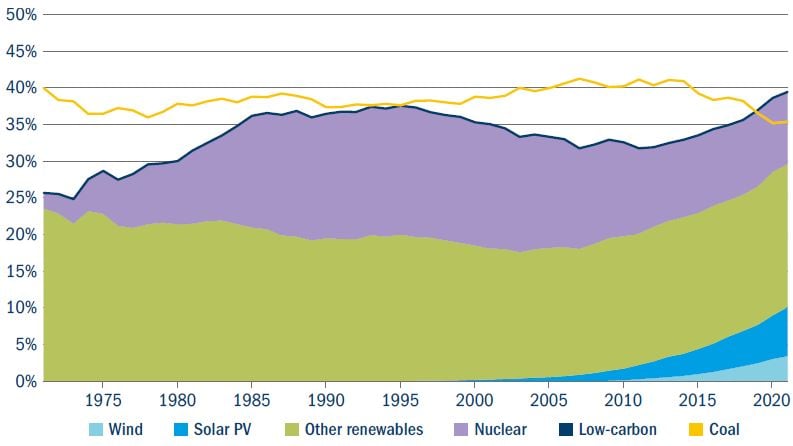
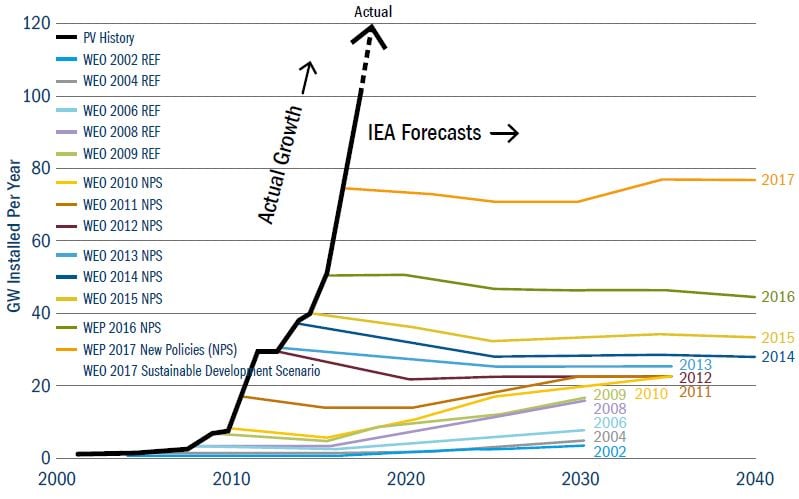
Figure 4: IEA new solar additions per year, forecast versus actual
This demonstrates two characteristics (and biases) about human behaviour.
1. Changing our initial belief is emotionally challenging (Confirmatory Bias)
2. We struggle to forecast exponentially (Anchoring)
Other relationships such as feedback loops are poorly incorporated into most models. Doctor Matthew Ives from the University of Oxford gives the example of electric vehicles (EVs), whereby the uptake of EVs drives the demand of additional electricity which in turn furthers the experience curves of renewable generation, which in turn drives cost declines for renewable energy as well as reducing operational costs for EVs – further accelerating EV uptake4. Examples of this include Daimler, which forecast 2021 sales for new EVs to be 2x 2020, but the first half (H) year results of 2021 actually showed them at 4x; and Mercedes, which expected it would almost double its EV share in 2021 from 7% to around 13% – however EV sales more than quadrupled in H1 2021 alone to a share in excess of 10%5.
Wright’s Law
In contrast to large energy models, there are already empirical models that can more accurately predict the cost declines associated with new technologies. One example is Wright’s Law which shows that cumulative production creates a consistent decline in costs – i.e. the more we deploy the more we learn. Hence cost- decline graphs are often referred to as “learning curves”. A US aeronautical engineer named Paul Theodore Wright observed this relationship while making planes in world war two (WW2)7.
Figure 5: Wright’s Law applied to different technologies
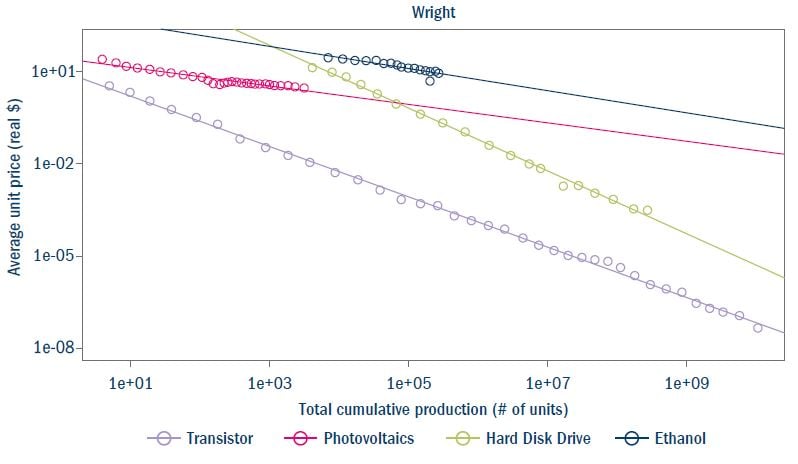
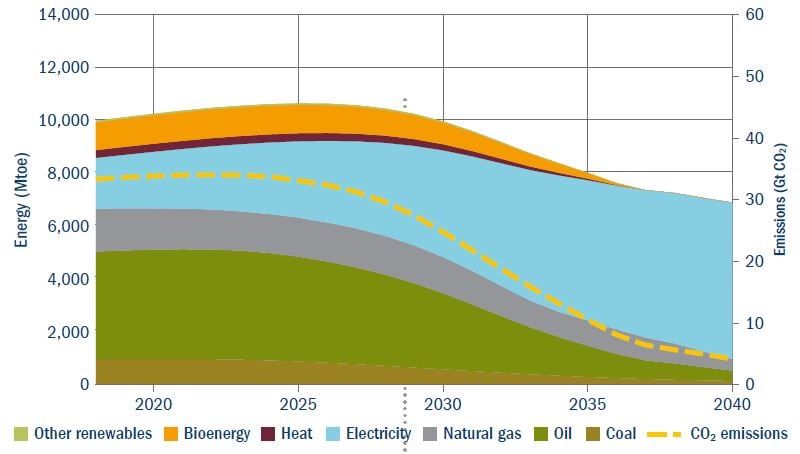
Figure 6: Global energy mix forecast using Wright’s Law to predict renewable energy cost declines
Technology leap frogs
Overcoming anchoring and conditions for exponential growth
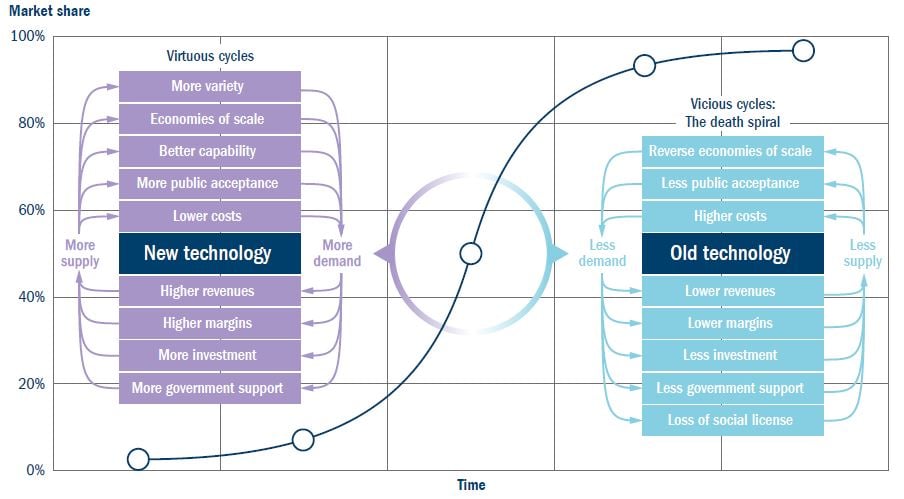
A critical question is why certain technologies grow exponentially and how these areas can be identified. Exponential growth is driven by the convergence of new technologies which trigger causal feedback loops within and across markets and sectors. Historically, these loops interact with and amplify one another, accelerating the adoption of new technology in a virtuous cycle while accelerating the abandonment of old technology in a vicious cycle. The relationship between EVs and renewable energy highlighted above has the potential to be one such example.
Figure 7: Virtuous and vicious cycles
In summary
« That’s the thing about exponential growth,
it doesn’t do much for a long time and then it comes and smacks you in the face. »
Dr Matthew Ives, 2022
Energy transition engagement: Green hydrogen
Company: Centrica
Sector and country: Energy, UK
Why we engaged
The company is in the process of updating its climate transition plan, with the aim to get to net zero by 2045, and for its customers to be net zero by 2050. This will include improving the number of smart meter customers, increases in the installation of EV charge points and heat pumps, and investing £100 million in low carbon and transition assets each year. We were interested in the role of green hydrogen in this process.
How we engaged
The company hosted an investor webinar.
What we learnt
The meeting enabled us to ask questions on the role of hydrogen in the domestic heating sector. Many experts are becoming sceptical around hydrogen’s role in this area. One reason being that heat pumps are about six times more efficient than green hydrogen. It was good to see that Centrica is balancing its efforts
between heat pumps and green hydrogen, and the company believes the hydrogen
value chain will evolve, with green hydrogen initially used in industry but expanding into domestic use. The UK is likely to be a test case for domestic hydrogen heating due to the development of hydrogen hubs and an abundance of very inefficient housing stock that could be better suited to hydrogen than heat pumps.
Outcome
We will continue to monitor developments at the company and within this field. Centrica’s leadership on energy transition and its role in the UK energy system provide a significant learning opportunity for us and the market more generally.